- Updated on April 23, 2023
![]() By Dr. Artour Rakhimov, Alternative Health Educator and Author
By Dr. Artour Rakhimov, Alternative Health Educator and Author
- Medically Reviewed by Naziliya Rakhimova, MD
BPT (Buteyko Practitioner Training) Module
How Buteyko teachers can measure progress of their students in breathing retraining
 End-tidal CO 2 (etCO2) monitoring (via capnography for example) has been a valuable tool in clinical settings (emergency medicine) for many decades (see medical reviews: Bhende MS, LaCovey, 2001; Cambra & Pons, 2003; Zwerneman, 2006).
End-tidal CO 2 monitoring has also been useful for breathing retraining, as it provides additional information about the progress of a person’s breathing normalization. Sometimes, however, etCO 2 monitoring is used as a feedback or biofeedback mechanism. On this page, we will look at the following two questions:
A: Can capnometers be used as an effective tool to measure the effectiveness of breathing exercises, or could it produce misleading results?
B: What is the scope of a correct application of capnometers and capnography in breathing retraining?
First, let us compare expected arterial, alveolar, and end-tidal CO 2 values in people with normal breathing and those who suffer from chronic diseases.
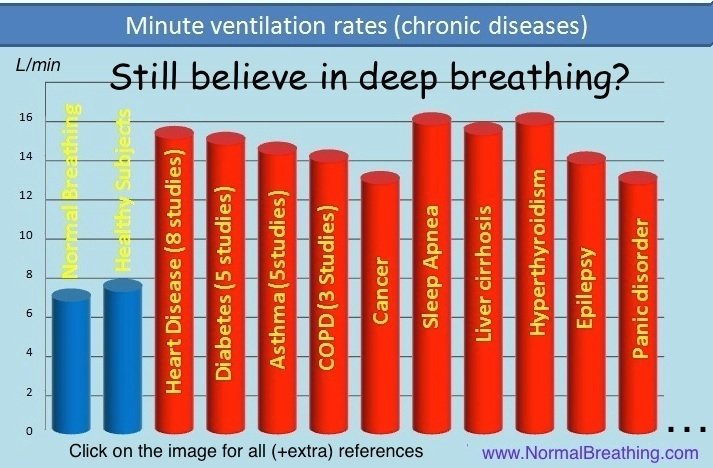
Since nearly 100% of people with chronic diseases suffer from chronic hyperventilation (alveolar hyperventilation), they should have reduced CO2 levels in the expired air since metabolism in all groups of people is about the same. The rate of CO2 production in all groups of people is the same. Hence, CO 2 levels in the expired gas is a parameter that accurately reflects minute ventilation.
Capnography waveforms, etCO2, and breathing patterns
Capnography can be used to measure end-tidal CO 2. In conditions of normal breathing (6 L/min, 12 breaths/min, 500 ml for tidal volume) etCO 2 is very close to alveolar CO2. Since problems with lungs are not common and gas exchange between alveoli and the blood is swift and effective, alveolar CO 2 reflects arterial CO 2. Hence, for normal breathing parameters, capnography can be used to define the CO 2 level in the alveoli and arterial blood. But what about etCO 2 levels in people who have increased minute ventilation?
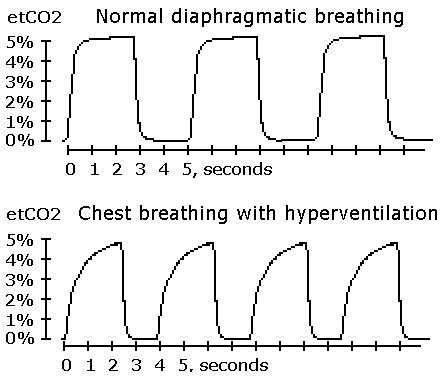
 The first problem with etCO2 monitoring relates to chest breathing. During normal diaphragmatic breathing (shown by the capnography waveforms graph), we get a nice alveolar plateau. As a result, it is easy to find the alveolar CO2 pressure that corresponds to the top of this plateau. (In this case, the alveolar CO2 is about 5% or 38 mm Hg, which is normal for some individuals.)
Chest breathing leads to a tricky effect that is described in 2 paragraphs of the bonus content right below here.
Chest or thoracic breathing causes abnormally high etCO 2 readings due to inhomogeneous (or uneven) lung ventilation. As the lower capnography waveforms show, there is no plateau since the last part of the exhalation has the gas coming from the CO2-rich bottom of the lungs and it is hard to tell what the real alveolar CO2 level is (as you can see on the graph, the etCO 2 is the same or about 5% or 38 mm Hg, but respiratory frequency is higher: about 15 breaths/min instead of 12).
From a physiological viewpoint, if we compare these 2 breathing patterns (the normal breathing pattern at the top capnography waveforms graph and chest breathing with hyperventilation at the lower capnography waveforms graph), chest breathing may have both reduced arterial CO2 and arterial O2 tensions due to hyperventilation with a ventilation/perfusion mismatch (heavy breathing still removes too much CO2, but uneven gas exchange compromises blood oxygenation).
[/sociallocker]
Thus, when the diaphragm of a person during breathing is moving in the opposite direction (called a diaphragm paradox or the paradoxical diaphragm phenomenon), one can get extremely high etCO 2 values, up to 2 times higher than for diaphragmatic breathing with the same lung ventilation.
Monitoring capnography waveforms and end-tidal CO2 biofeedback during breathing exercises
 If a person holds his breath, the etCO 2 reading is going to show zero (no CO2 exhaled). Obviously, the alveolar and arterial CO2 values increase during breath-holding.
If a person has a very shallow breathing pattern (with the tidal volume as his dead space or about 200-250 ml), there would be almost no gas exchange (minimal gas exchange will take place due to diffusion). Hence, that person’s capnography will show a very low end-tidal CO2 level, but the alveolar and arterial CO2 pressures will be much higher and increasing in time.
This effect could also be understood from the viewpoint of CO2 accumulation. If a person holds his breath, that person’s body accumulates CO2, and it’s etCO 2 is going to be zero. If a person performs a Buteyko reduced breathing exercise (breathing about 15-20 % less air with reduced minute ventilation), it will take several minutes before stable CO2 values will be shown by the capnometer since large amounts of CO2 can be dissolved in the blood and intra- and extra-cellular fluids. Hence, it will take several minutes (up to 5-7 min) for the stable waveforms to appear. Would etCO 2 represent arterial CO2 then?
Let us look at it in more detail. If the person practices a Buteyko reduced breathing exercise with strong air hunger (both minute ventilation and tidal volume are reduced about two times), end-tidal CO2 monitoring is not going to reflect the alveolar CO2 concentration. Physiological studies have also found that people with larger tidal volume and reduced respiratory frequency have abnormally high etCO 2 values. Since reduced breathing in the sick (those with less than 20 s for the body oxygen test or more than 12 L/min for minute ventilation at rest) is done with increased respiratory frequency and reduced tidal volume, they can get low etCO 2 numbers, while in reality their alveolar and arterial CO2 will be increasing during the whole session (e.g., 10-15 minutes).
Vice versa, if a person starts a deep breathing exercise with increased minute ventilation while deliberately extending exhalations (to push all high-CO2 air out from the lungs), their etCO 2 capnography monitoring will show increased etCO 2 levels, while alveolar and arterial CO2 concentrations will become less and less.
 Western medical doctors also observed these effects during anesthesia. An extensive review of medical literature resulted in the article ” Misleading end-tidal CO2 tensions” (Wahba & Tessler, 1996). In the abstract of the study, the authors wrote, “RESULTS: (1) Patients with systemic disease, or when placed in the lateral position, or with haemodynamic instability, have an increased Pa-PETCO 2 gradient… (4) The magnitude and direction of change in PaCO2 and PETCO 2 can be disproportionate and in the opposite direction.“
Finally, there are psychological factors that can seriously distort etCO 2 capnography results. When someone holds a capnometer under your nose, it is difficult to maintain the automatic breathing pattern. Our breathing parameters undergo large changes as soon as we pay attention to our breath.
For example, most experienced Buteyko breathing students that practiced Buteyko breathing hundreds of times know that hyperventilation is not good. As such, many of them may start reducing breathing as soon as there is something under their nose. (Many Buteyko teachers even say to their students, “Japanese samurai had a feather under their nose for 1 hour every day to train their breath. The goal was to have this feather motionless.” Hence, the capnometer could immediately trigger this image.)
 Other people may remember about the importance of deep breathing as soon as someone holds a device under their nose and start breathing less.
In these cases, the effects will be opposite: the Buteyko student will get abnormally low etCO 2 (and higher arterial CO2), whereas a “deep breather” will get unusually high etCO 2 with reduced arterial CO2 concentrations.
Hence, etCO 2 monitoring and capnography are not useful as biofeedback, but can be used in the long run (e.g., once per day or once per week), as an additional tool for breathing retraining control. This is how Dr. Buteyko viewed and described capnography.
Capnometers for monitoring sessions with the Frolov/DIY breathing devices
For the application of breathing devices (such as the Frolov breathing or the DIY breathing device), the situation is different since the person that practices the breathing exercise needs to take large diaphragmatic inhalations and exhalations. In such cases, the capnometer can be used to measure CO 2 inside the breathing device or near the place where air leaves the device. For such applications (e.g., for the Frolov breathing device therapy), the results will show real CO 2 values in the container at the end of exhalations, and etCO 2 monitoring and capnography waveforms can be used as biofeedback.
Measuring CO 2 in clinical trials
Is there a different clinical method, that does prove effective for monitoring changes in CO2 for breathing retraining? This is a common question for breathing students who are eager to get some additional scientific reassurances. A suitable method to monitor changes in C0 2 is to measure the total CO 2 of all exhaled air. This was done in the famous Pascenko trial on cancer that also applied Buteyko reduced breathing exercises. Note that Pascenko could surely include etCO 2 numbers in his paper, but he did not do so since he knew that this parameter does not reflect the process of breathing retraining. He simply collected all exhaled CO 2 in a bag and measured the total CO 2 level for the exhaled gas (the result can also be used to measure minute ventilation).
Finding alveolar CO2 is a very hard task. Inserting devices inside the lungs can be done only for animals. Hence, for human studies, we can only analyze the outer parameters. It seems measuring alveolar CO 2 is only possible with knowledge of exact airflow distribution over time. This is the way Dr. Buteyko utilized this parameter in the 1960s by using his combine or “complexation.”
Alternatively, or in addition to total CO 2, one can use or measure: – arterial CO 2 (as for the Buteyko trial on 52 children in Sechenov’s Medical Institute, Moscow, 1981). However, one can only measure arterial CO 2 in subjects that do not have a ventilation-perfusion mismatch (thus, not for COPD or emphysema patients). Venous CO 2 values are also meaningless in these cases.
– MV or minute ventilation
– the CP.


